Ad Format & Zone Type Stats
November 11th 2019
What’s new?
Advertisers can now filter their Statistics tab by ad format and by the type of ad zones targeted, while Publishers can now filter their Statistics tab by ad zone type.
What can this new feature do for me?
As an Advertiser, you can now see how well your ad formats are performing and how effective your targeting of ad zone types is. As a Publisher, this feature gives you insight into the performance of the different ad zone types you are using.
Details
For Advertisers

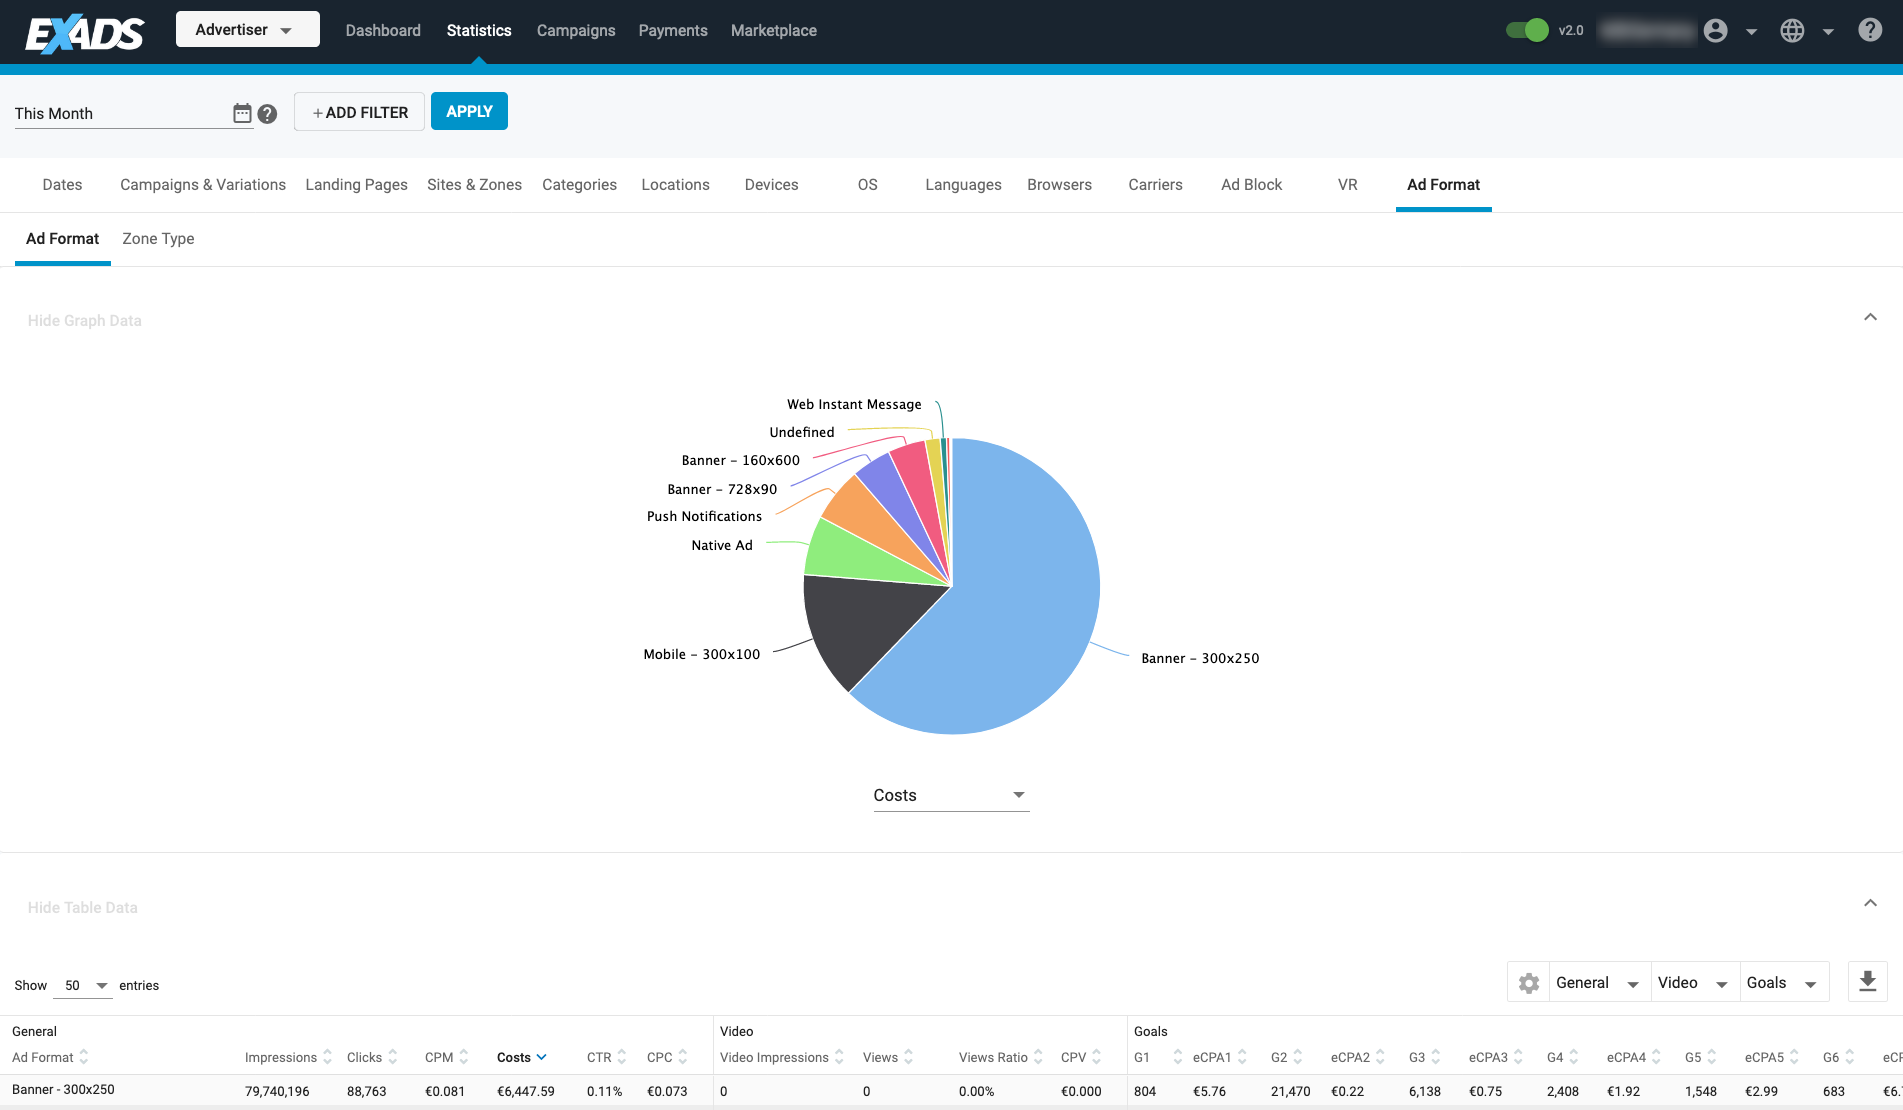
In the Statistics tab, click on the Ad Format tab and you will see two subtabs: Ad Format and Zone Type.
- In the Ad Format sub-tab, the Graph Data will show a pie chart breaking down your data by ad format. In the Table Data at the bottom of the screen you will see your campaigns broken down by Ad Format.
- In the Zone Type sub-tab, the Graph Data will show a pie chart breaking down your data by Zone Type. In the Table Data at the bottom of the screen, you will see your campaigns broken down by Zone Type.
Note: As in other areas of the Statistics tab, clicking on an item of the table data of the Ad Format sub-tab will drill down into the Zone Type sub-tab. There you will see the zone types that correspond to the ad format you selected.
Note: As in other areas of the Statistics tab, when in the Zone Type sub-tab, clicking on a zone type in the Table Data will filter the Graph Data for that zone type.
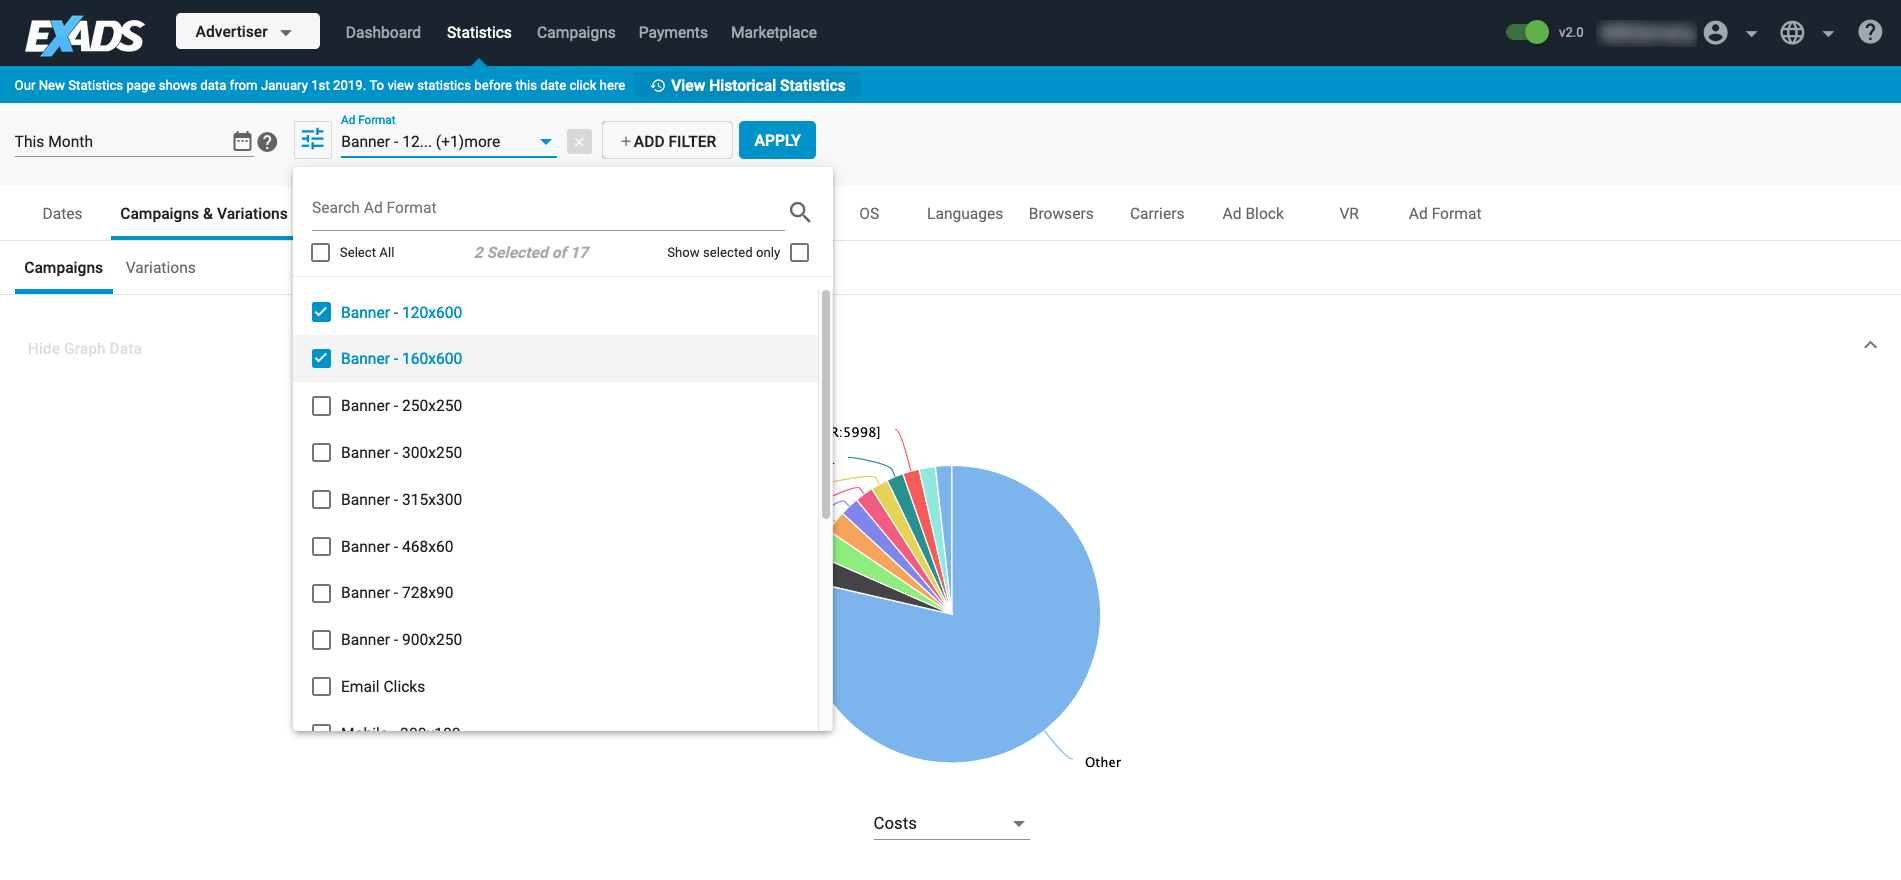
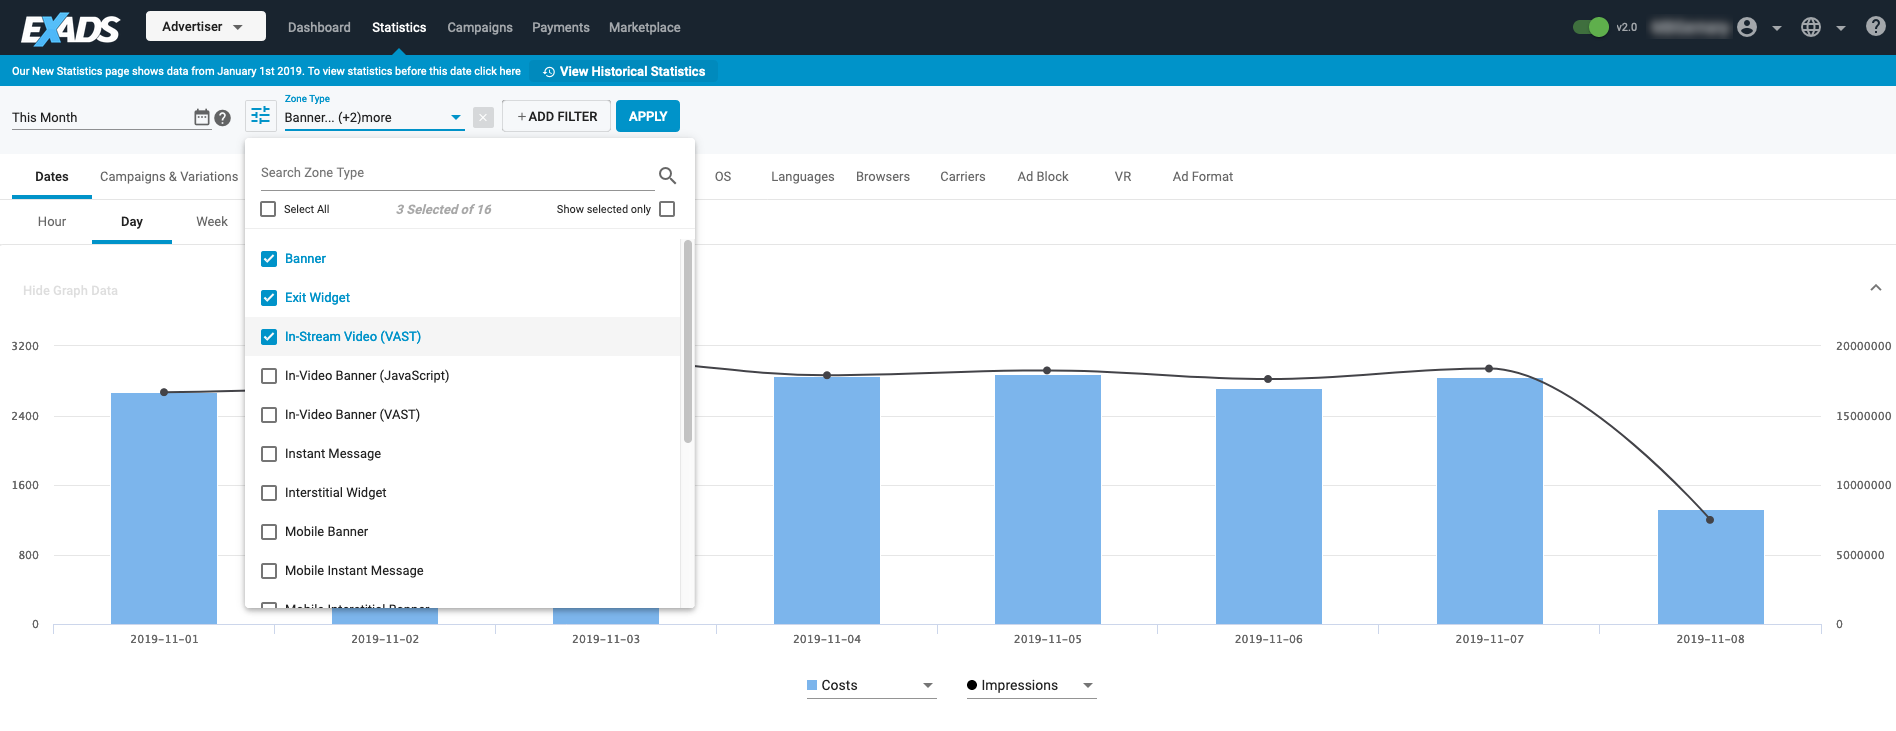
To filter any tab by ad format or zone type, click on the Add Filter button and select Ad Format or Zone Type. You can Select All or tick the checkbox beside the ad format or zone types you wish to filter by.

For Publishers

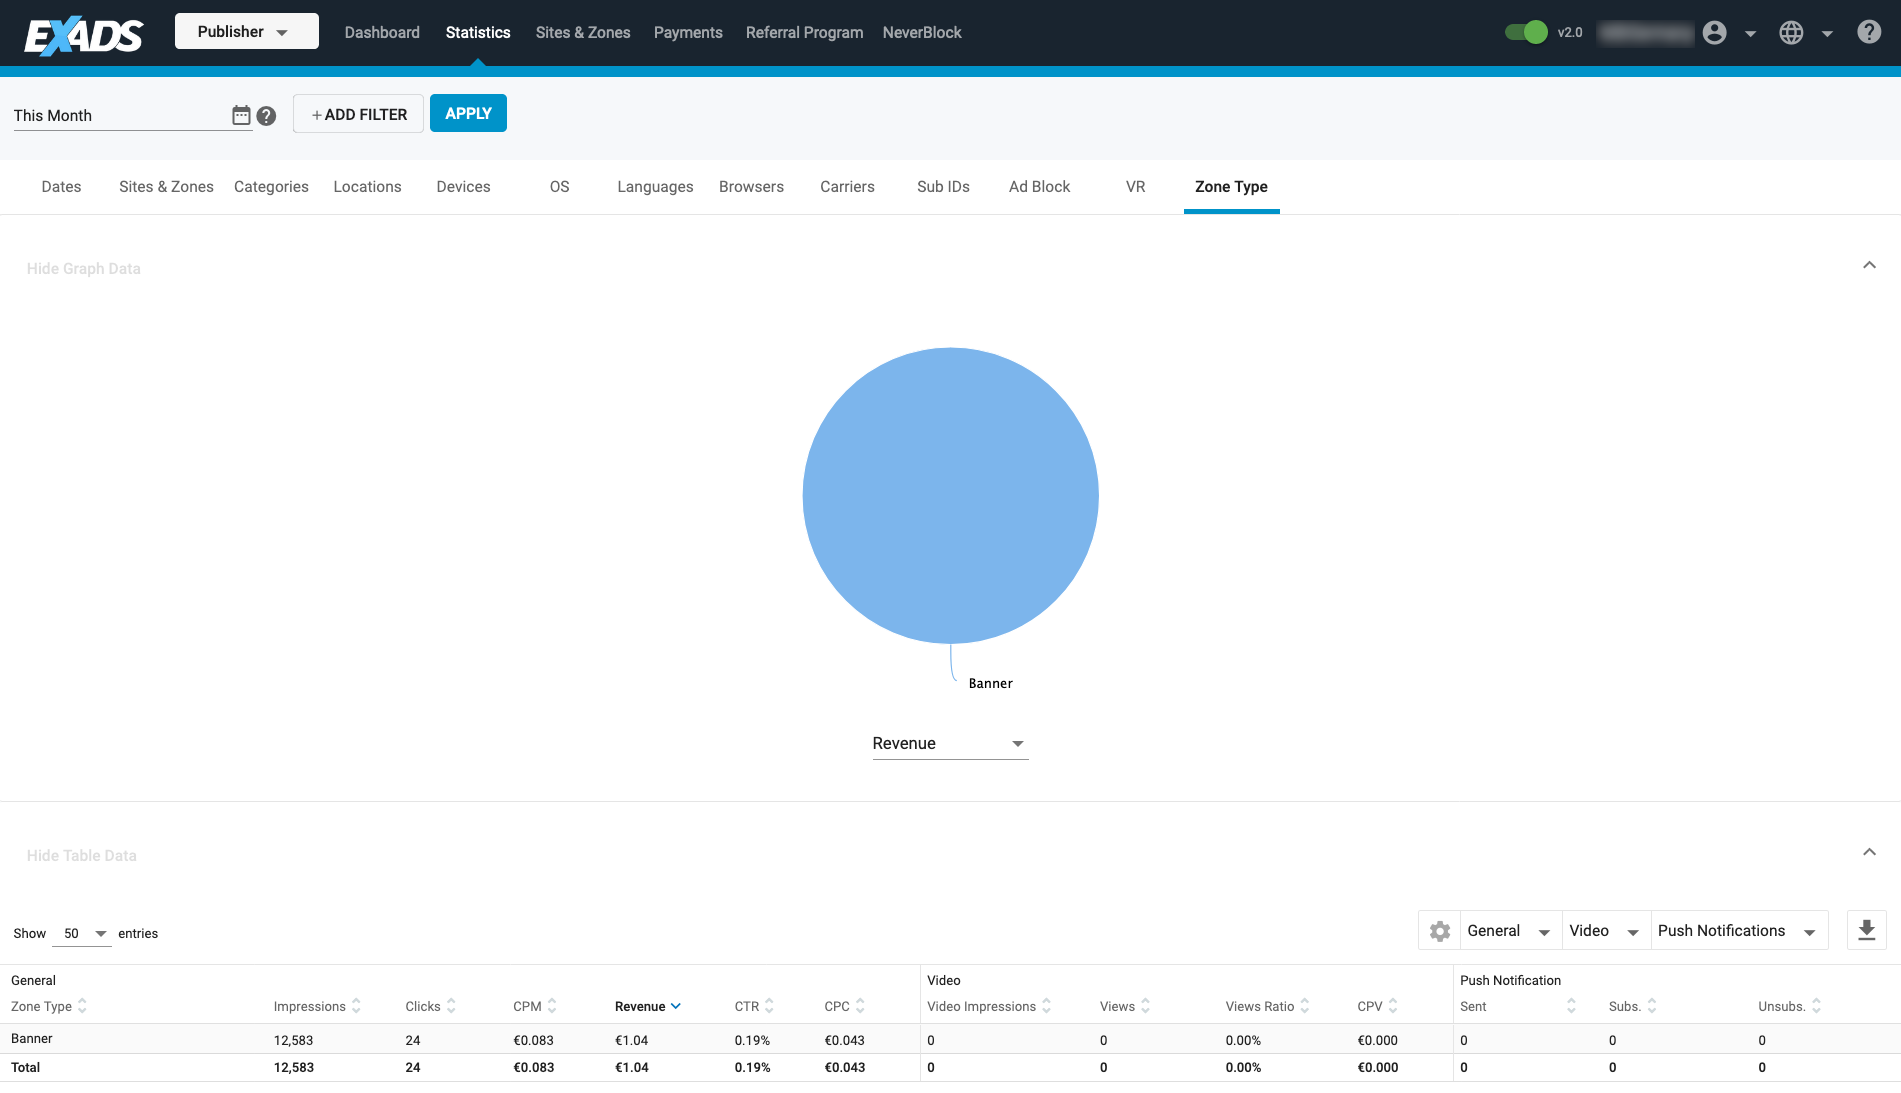
In the Statistics tab, click on the Zone Type tab.
The Graph Data will show a pie-chart breaking down your data by the ad zone type that was used. The Table Data will show also your data broken down by ad zone type.
To filter any tab by zone type, click on the Add Filter button and select Zone Type. You can Select All or tick the checkbox beside the zone types you wish to filter by.
Note: As in other areas of the Statistics tab, when in the Zone Type tab, clicking on a zone type in the Table Data will filter the Graph Data for that zone type.

Video
Please view the video to see a demonstration of these changes.
