Documentation

Documentation

  • General
  • Advertisers
  • Publishers
  • RTB
  • API
  • News

›May 2020

August 2023

  • Ad Refresh

July 2023

  • Conversion Count and Tracking Window

January 2023

  • BitPay for Publishers

November 2022

  • Auto Recharge with SafeCharge

September 2022

  • Saving Filter Reports on Statistics
  • UnionPay with SafeCharge Integration

August 2022

  • Bidder Improvements for Targeting Zones
  • Notifications System

July 2022

  • Drag, Drop and Expand Dashboards

June 2022

  • Video CTA

May 2022

  • Adding New Dashboards
  • SafeCharge Integration

April 2022

  • Cryptocurrency Payment for Advertisers

February 2022

  • Conversion Tracking Improvements

January 2022

  • IAB TCF v2.0

December 2021

  • Dashboard Custom Title
  • Native Campaigns on Push & In Page Push Notification Ad Zones
  • Save Cards for Card Payments
  • Changes to Media Library Tab

November 2021

  • Auto Recharge for Card Payments
  • Circle Payment

September 2021

  • Account Wide Blocking Of Sites
  • Bidder Improvements

August 2021

  • In-Page Push Notifications Format
  • Frequency Capping - CPC Campaigns
  • Sub ID Targeting and Blocking
  • Event creativeDisplayed for Fullpage Interstitials
  • Site Blocking and Targeting on Campaigns

July 2021

  • Multi-Format Statistics

May 2021

  • Multi-Format Ad Zones

April 2021

  • Asynchronous Tags
  • Dashboard Filters

February 2021

  • New EXADS Status Page

January 2021

  • Outstream Video

September 2020

  • RTB Mobile & Desktop Fullpage Interstitial
  • RTB Email Clicks

August 2020

  • Heavy Banner Limits

July 2020

  • Ad Formats Cleanup
  • Desktop Fullpage Interstitial

June 2020

  • Native Ads Changes
  • New Dashboard Dimensions
  • Google Compliance Changes
  • Archiving Variations
  • Dashboard - New Combo Chart
  • New Languages Available
  • CPM/CPC Floor Pricing

May 2020

  • Heavy Banner Limits
  • Media Library Videos
  • Video Slider Density
  • New Push Notifications Format
  • Dashboard Customization

April 2020

  • Smart CPC Pricing
  • Mobile Fullpage Interstitial - Clicks

March 2020

  • Creatives Optimization
  • Mobile Fullpage Interstitial - Chrome
  • Hour/Day Intervals tab

February 2020

  • Mobile Fullpage Interstitial
  • Major Improvements to the Campaign Flow
  • Chrome Enabled Switch

January 2020

  • RTB Wins Notice
  • New Daily Impressions Delivery Mode
  • Copy Visible Data

Older Posts

  • Ad Format & Zone Type Stats
  • New VR Detection Feature
  • Improved Browser Detection
  • The Media Library Tab
  • Dynamic Tokens in Native Ads
  • Bulk Update
  • Improved Device and OS detection
  • New Distribution Algorithms
  • RTB Direct Link
  • New UI Changes

Dashboard Customization

7th May 2020

What’s new?

dashboard

We have made it possible for both Advertisers and Publishers to customize the data shown in their Dashboard. You can now choose from a selection of metrics and dimensions to show in any one of the six panels, and display them in tables or a range of charts.


What can this new feature do for me?

As an Advertiser or Publisher, this feature allows you to focus your Dashboard on the particular data that is most relevant to your business. This will allow you to see at a glance what you most need to know, to enable you to make better decisions.


Details

In the Dashboard tab, you will now see a settings icon in the top right of each of the six panels. Click on it to customize the data shown in any of the panels.

The Dashboard Settings dialog box will appear. Here you can set what metrics and dimensions you wish to see in this panel: There is a comprehensive list of Metrics and Dimensions available to give you useful insights into your data.

Set whether you wish to see a Chart or a Table using the switch.


Creating a chart

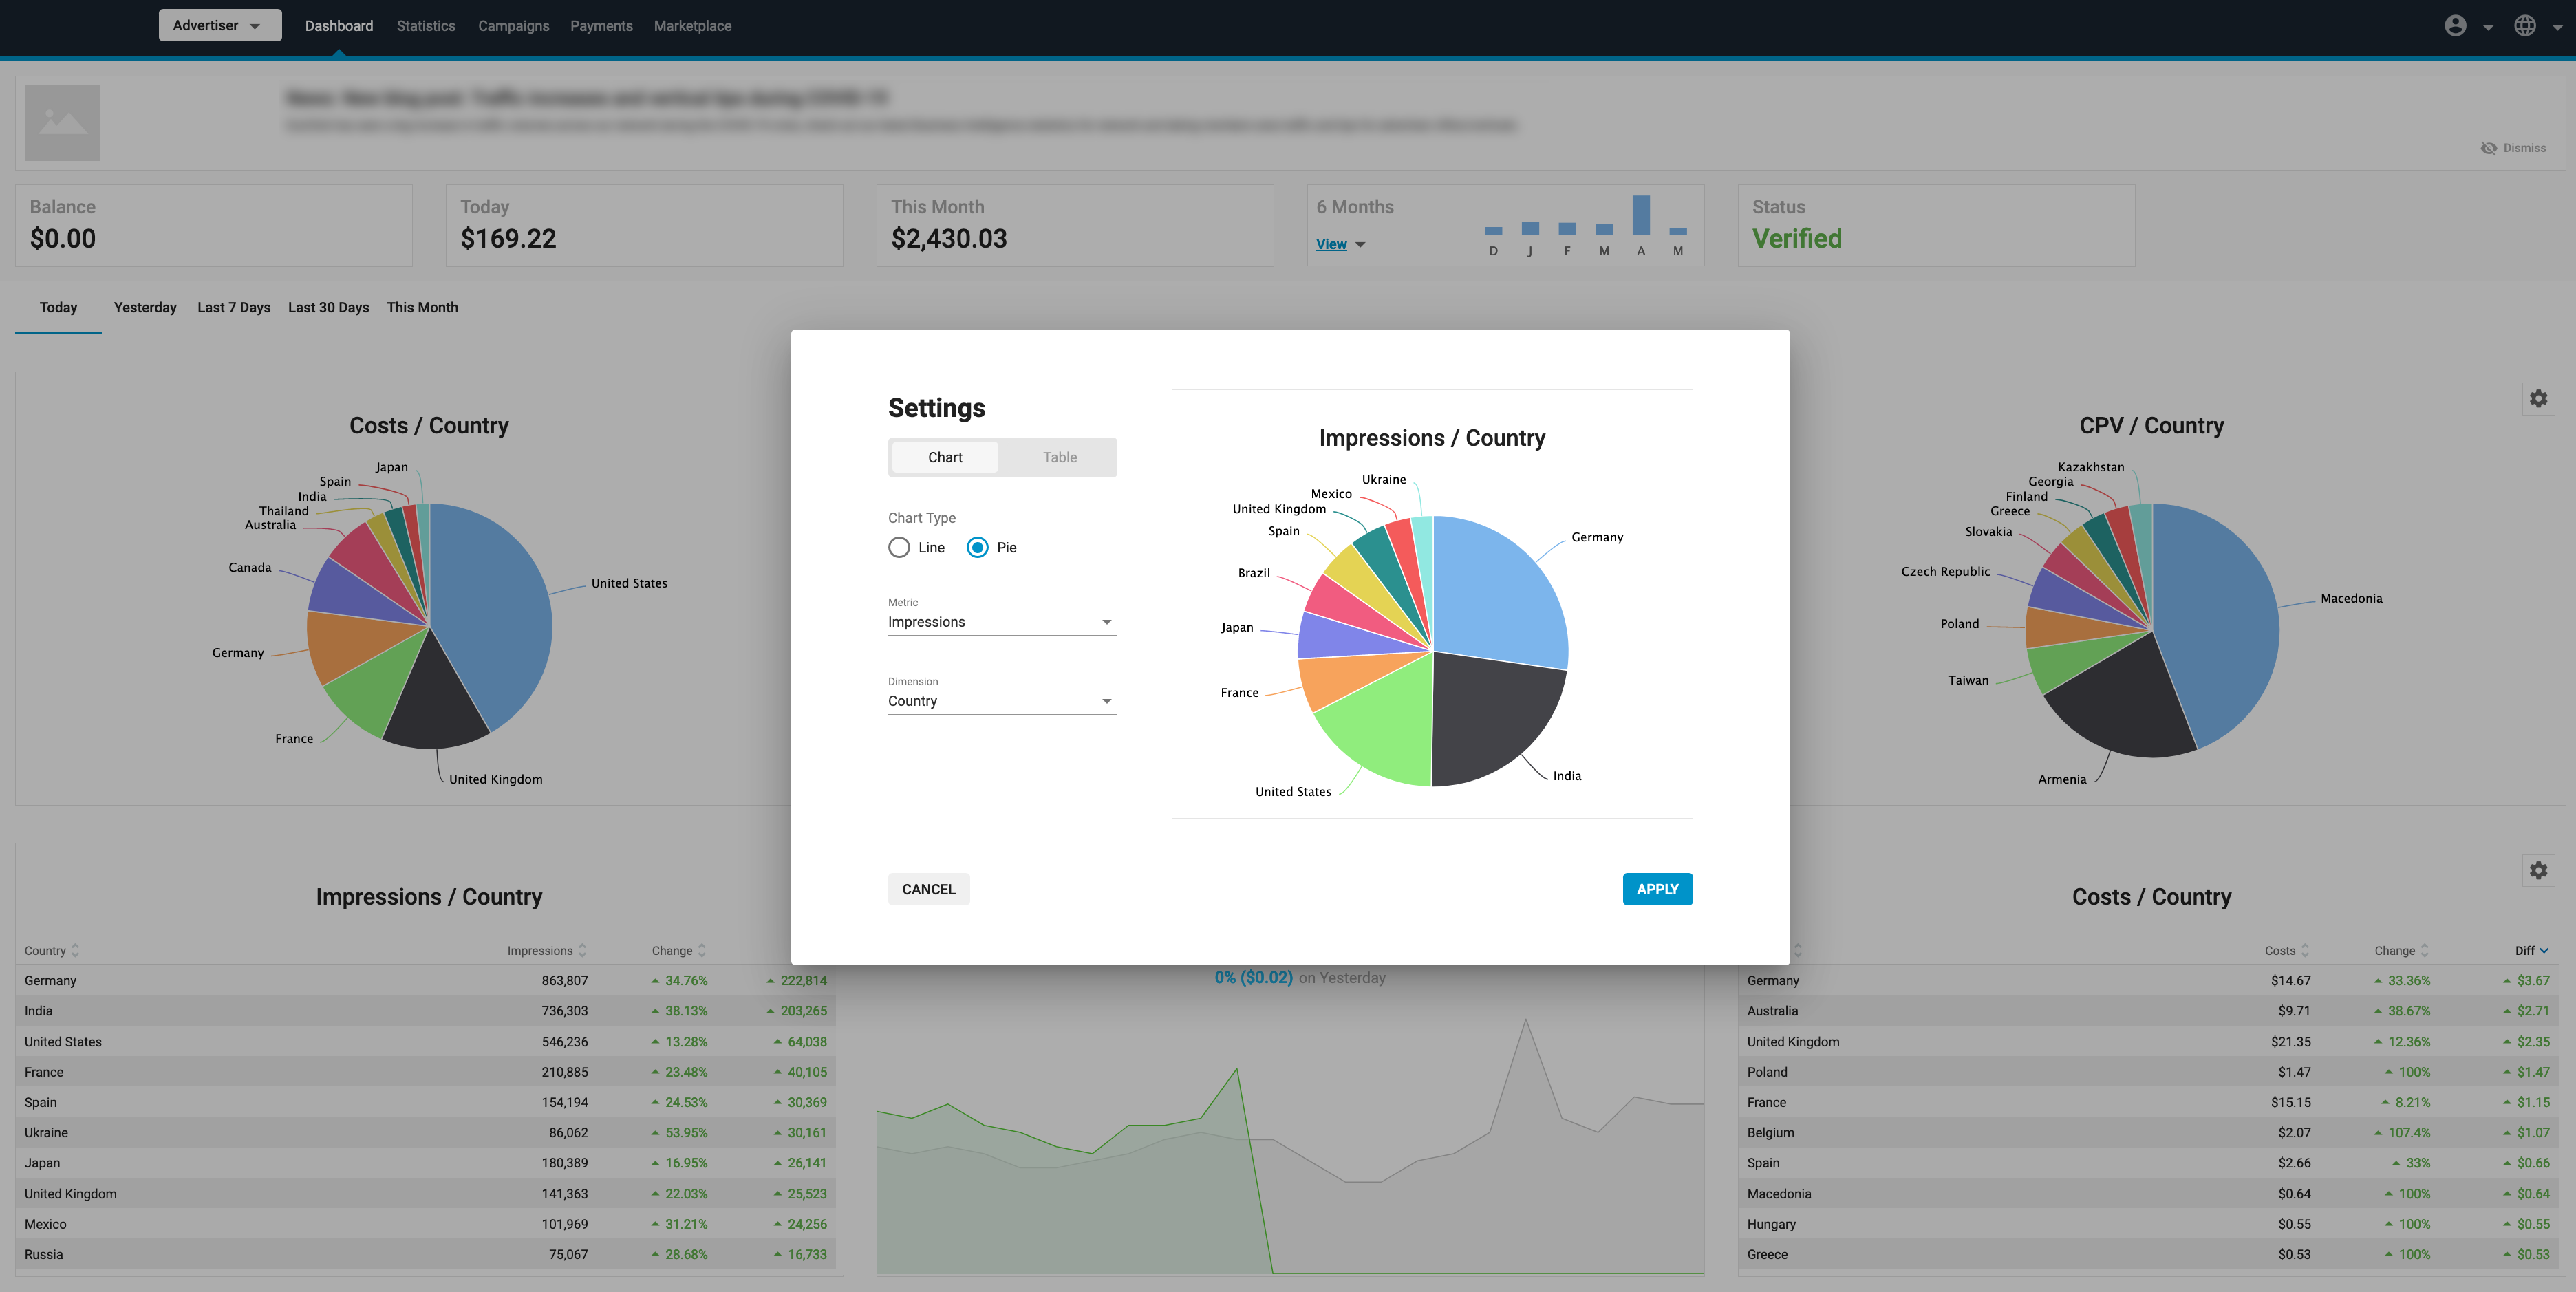
If you choose Chart you can then select whether to show a Line chart, or Pie Chart:

  • Line: Select a Metric to show on the line graph. This will show two lines, a red/green line for the selected time period e.g. days, and a grey line for the corresponding time period before that.
  • Pie: Select a Metric to compare with a Dimension from the drop-downs.

You will see a preview of your chart on the right side of the Dashboard Settings box.

Click Apply to show this chart on your Dashboard.


Creating a table

If you choose Table, select a Metric to compare with a Dimension in the table.

You will see a preview of your table on the right side of the Dashboard Settings box.

Click Apply to show this table on your Dashboard.


Note: We will continue to add more dimensions to the dashboard to give you even more flexibility.


Demo Video

← New Push Notifications FormatSmart CPC Pricing →
  • What’s new?
  • What can this new feature do for me?
  • Details
    • Creating a chart
    • Creating a table
  • Demo Video
Documentation
Community
Github
Useful Links
EXADS
Copyright © 2025 EXADS