Dashboard Filters
April 8th 2021
What’s new?

As an Advertiser or Publisher, you can now filter the tables and charts on your Dashboard in multiple ways.
What can this new feature do for me?
These filters allow you to control exactly what information shows in each table and chart on your Dashboard so that it is more relevant to you. For example:
- As an Advertiser, you could create a Line chart showing today's spend, and then filter it by Browsers.
- As a Publisher, you could create a Pie chart showing CPC price, and then filter it by Countries.
Details

As either an Advertiser or a Publisher, click on Edit Settings on any widget on your Dashboard tab,
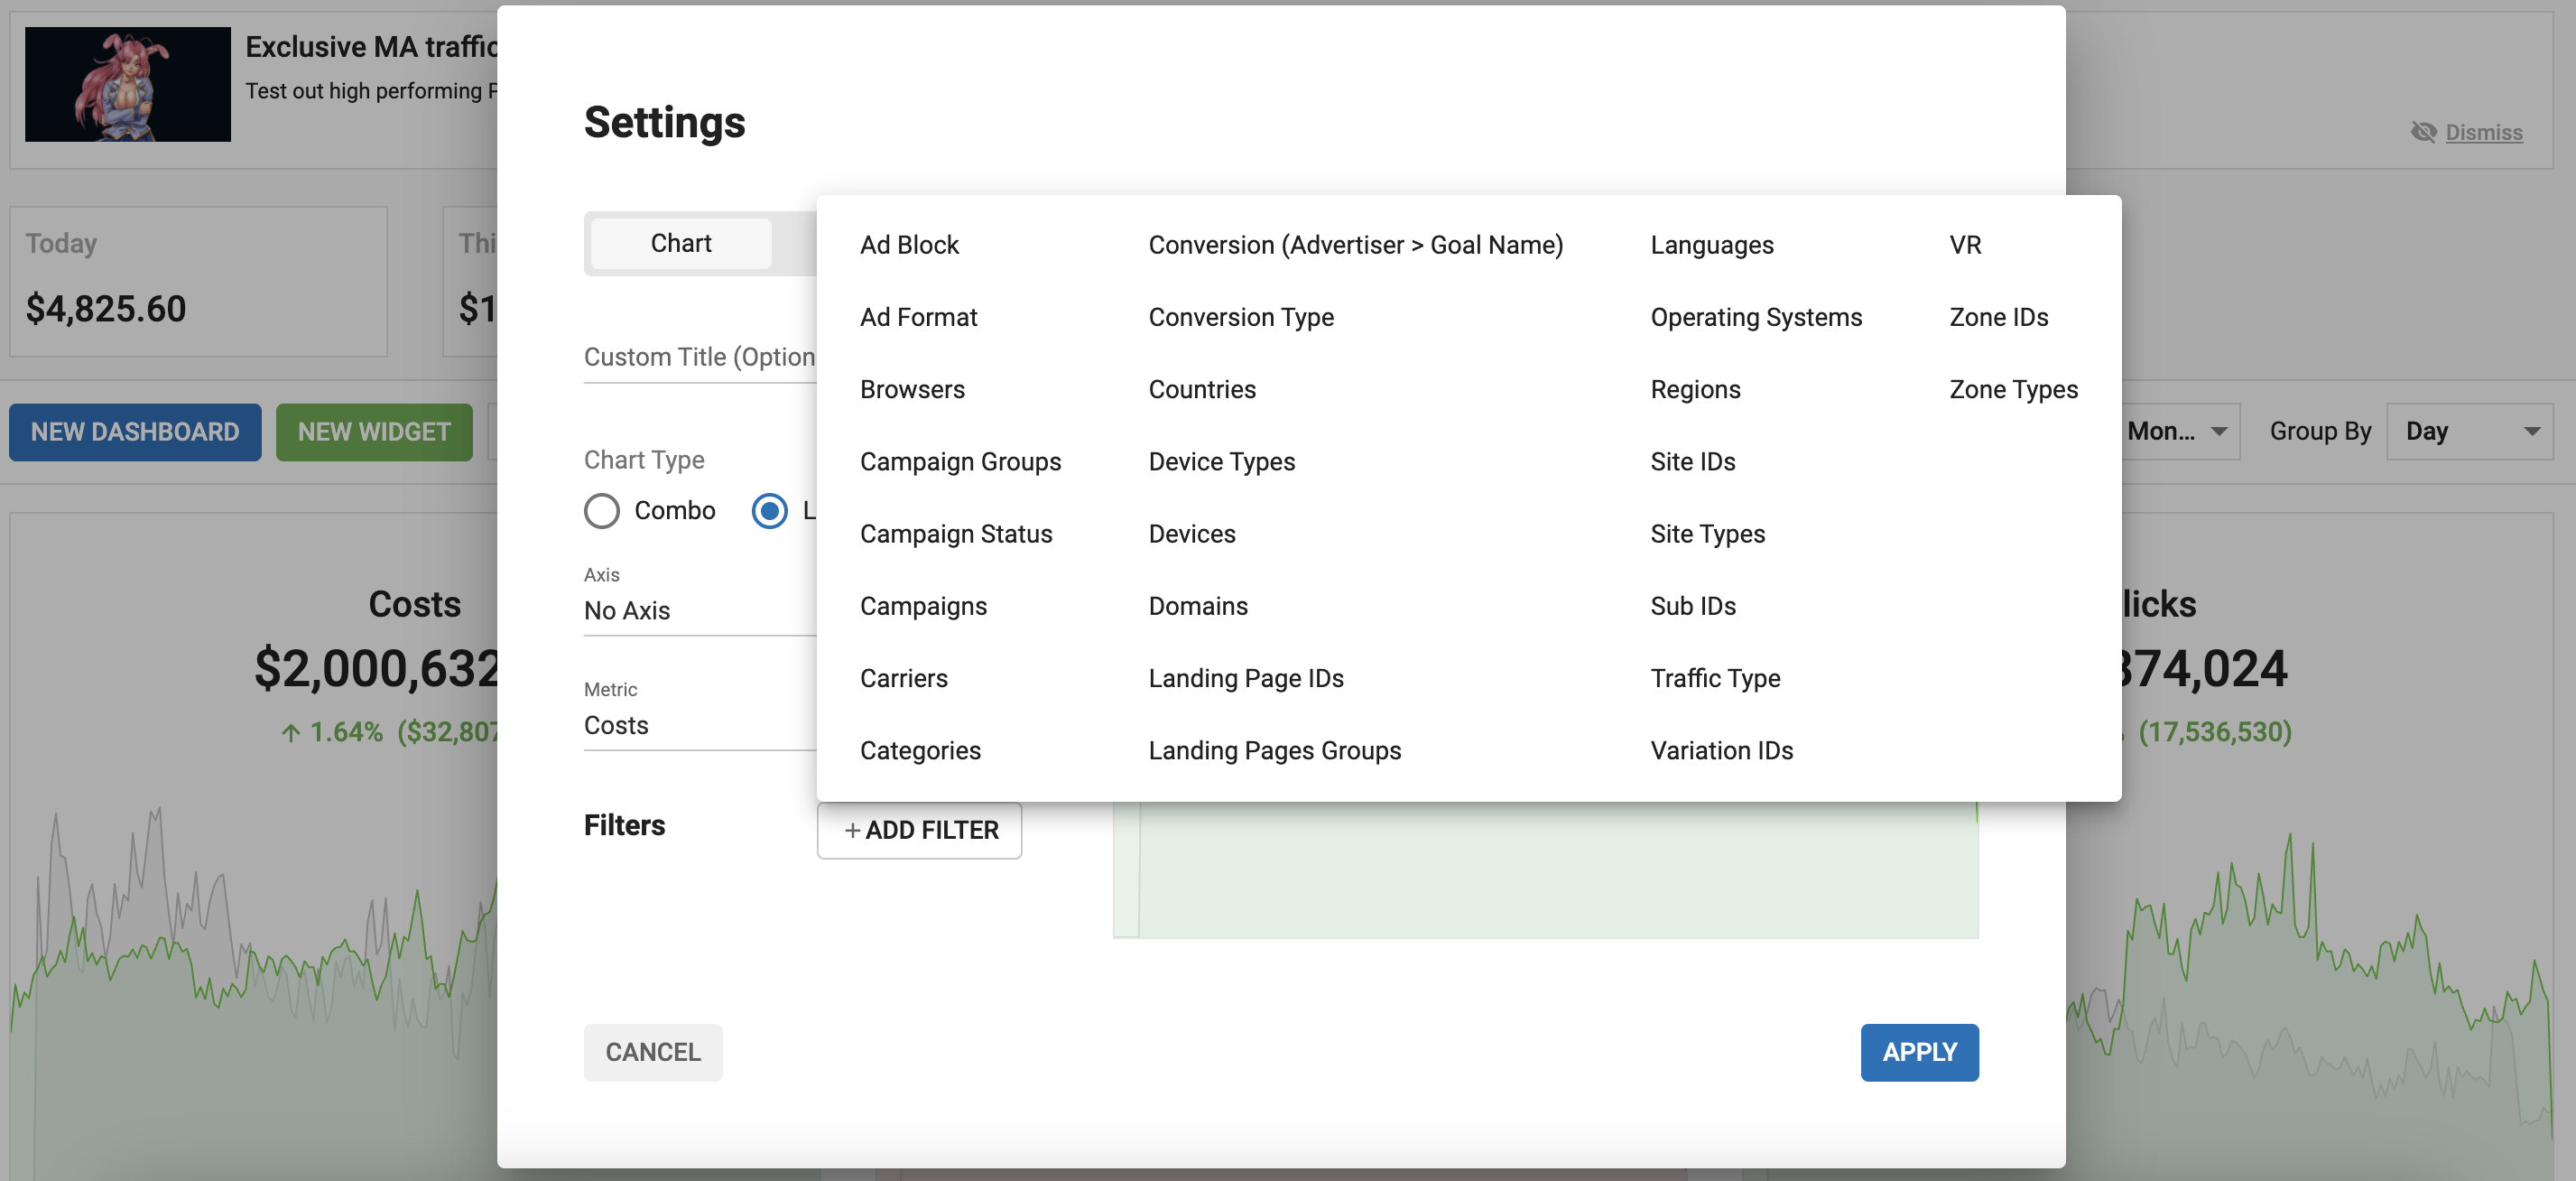
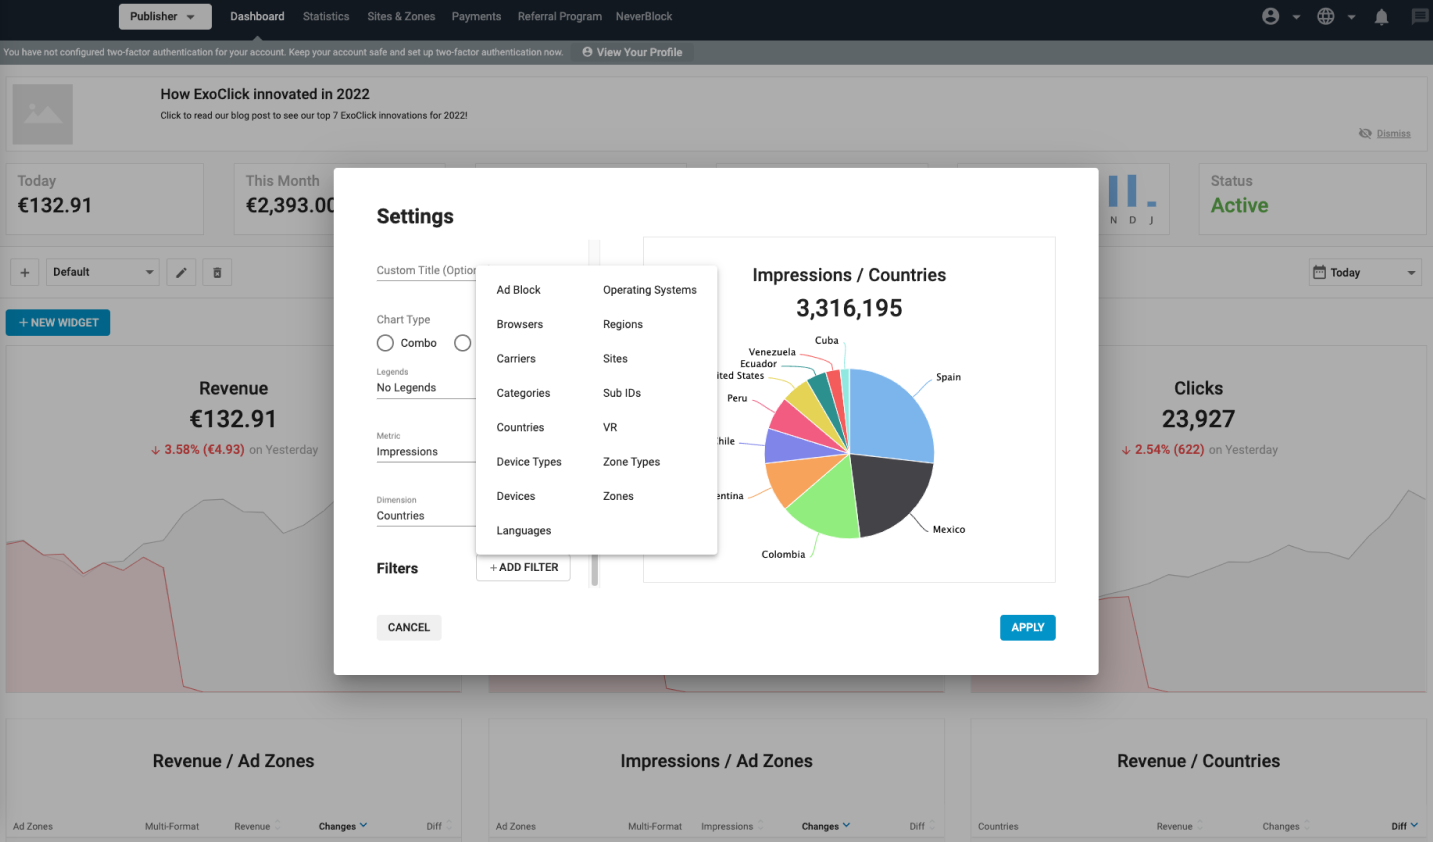
Click the +Add Filter button at the bottom of the Dashboard Settings panel, and select a filter from the list:
When you choose a filter, you can then choose which items you wish to filter by: For example, if you choose to filter by Browsers, you can then use the checkboxes to choose which browsers to filter by.
Use the Show selected only checkbox to exclude the items that you haven't selected, and choose Select All to select all items.
You can add multiple filters by clicking on the Add Filter button again.
Once you have added the filters you require, click on the Update Preview button on the chart or table to see how it looks.
Once a widget has had a filter applied, you will see a Filter applied symbol on the left side of it:

Demo Video
Please watch this video to see a demonstration of these changes.
Available Filters for Advertisers
- Ad Block
- Ad Format
- Browser Versions
- Browsers
- Campaign Groups
- Campaign Status
- Campaigns
- Carriers
- Categories
- Countries
- Device Types
- Devices
- Domains
- Landing Page IDs
- Landing Pages Groups
- Languages
- Operating Systems
- Regions
- Site IDs
- Sub IDs
- Variation IDs
- VR
- Zone IDs
- Zone Types
Available Filters for Publishers
- Ad Block
- Browser Versions
- Browsers
- Carriers
- Categories
- Countries
- Device Types
- Devices
- Languages
- Operating Systems
- Regions
- Sites
- Sub IDs
- VR
- Zone Types
- Zones
