
Statistics
The Statistics tab shows you a broad range of information about your campaigns. It allows you to gain insights into the performance of your campaigns and diagnose problems when they occur. The Graph Data panel at the top of the screen shows you charts of data related to your campaigns, while the Table Data panel at the bottom shows you tables of important data for recent dates, as well as the cost of achieving selected goals.
The information in the Statistics tab is broken down across several tabs: Dates, Campaigns & Variations, Landing Pages, Sites & Zones, Categories, Locations, Devices, OS, Languages, Browsers, Carriers, Ad Block, VR, and Hour/Day Intervals.

By default, data is displayed using the New York time zone (EST or EDT). You should bear this in mind when analyzing statistics shown for your own time zone.
However, you can change the statistics time zone by clicking on your Statistics page and selecting the Hour tab. In the bottom right of the graph on this tab, you can set the time zone for your data based on your country targeting.
Dimensions available
Below is the list of all dimensions available to advertisers:
| Group | Dimension Name | Values |
|---|---|---|
| Dates | Year, Month, Week, Day, Hour. | |
| Campaigns & Variations | Campaign Groups | Contains values for the campaign groups defined for grouping campaigns. |
| Campaigns | Contains values as defined in Campaign Name. | |
| Variations | Ad Variations uploaded for campaigns. | |
| Landing Pages | Groups | Contains values for Ad Destinations set when creating campaigns. |
| Landing Page | Contains values for Ad Destinations set when creating campaigns. | |
| Sites & Zones | Domains | Contains values for the publisher domains. |
| Site Types | Contains values for Site Types. | |
| Sites | Contains values for Site names. | |
| Ad Zones | Contains values for Zone names. | |
| Sub IDs | Contains values for SubIDs numbers. | |
| Categories | Contains the Categories from the pages where the ad was shown. | |
| Locations | Countries | Contains values for countries as per IP address. |
| Regions | Contains values for regions as per IP address. | |
| Devices | Device Type | Contains values for device types such as Desktop, Mobile, Smart TV, Console, etc. |
| Devices | Contains values for devices in the format of device type and manufacturer name, such as Mobile-Iphone, Mobile-Samsung, Tablet-IPad, etc. | |
| Operating Systems | Contains values for the operating systems used on the devices where ads were requested. | |
| Languages | Contains values for the end users' languages. | |
| Browsers | Contains values for the end users' browsers. | |
| Carriers | Contains values for the end users' mobile carriers. | |
| Ad Block | Ad Block Users - End users with AdBlock software enabled and detected. | |
| Standard Users - End users without AdBlock software enabled. | ||
| VR | VR Users - End users who are requesting ads via VR. | |
| Standard Users - End users who are not requesting ads via VR. | ||
| Ad Format | Ad Format | Contains values for the Ad Formats in which the ad was shown. |
| Zone Types | Contains values for the Zone Types where the ad was shown. | |
| Hour/Day Intervals | Day of Week | Contains values for the days of the week. |
| Hour of Day | Contains values for the hours of the day. | |
| Traffic Type | Depending on your ad server configuration such as Premium, Members Area, Email Clicks, etc. | |
| ISP | Contains values for the Internet Service Provider where the traffic comes from. | |
| Pricing Model | Values depend on the pricing models set at the ad server level, i.e. CPC, CPM, Smart CPM, etc. |
Saving Custom Filter Set
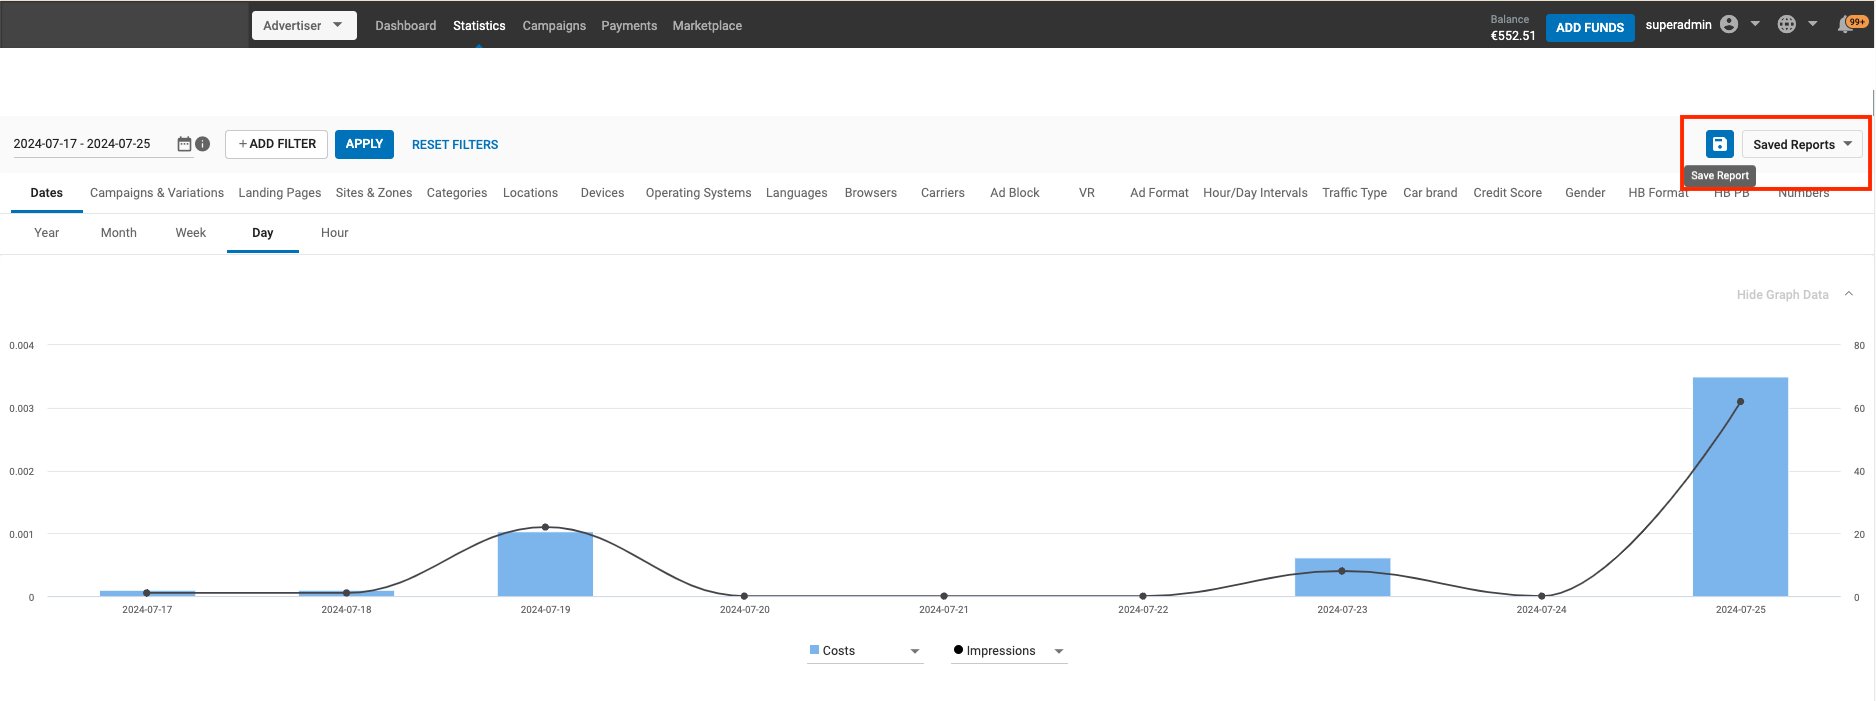
Using the Save Reports option, you can save filter sets on the statistics page, give this filter set a custom name, and choose from a list of previously saved filter sets.
Saving a report
As a user, the default view of the statistics tab will not have any filters applied. You can either save a filter report by adding a few filters of your choice or choose from the list of already saved filters to obtain the desired view.
Note:
The Statistics page will be reset once you leave to go to another page in Admin Panel.
You can see the list of saved filters in the Saved Reports dropdown.
The order of sorting the Saved reports will be the latest one created on top.
Update the existing report or Save As a new report
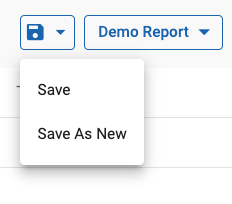
Save
- You can update an existing saved report by selecting it, changing the filters and then clicking on the Save button.
- The filter setting will be updated and saved under the chosen Saved Report.
Save As New
- You can save an existing filter set with another name.
- You can save a new report by adding or removing a few filters from this set.
Rename, Delete a Saved Reports
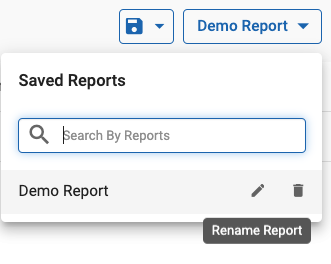
You can edit or delete a report using the action buttons next to each saved report in the Saved Report drop-down menu
- The Pencil Icon helps rename a Saved Report. Note that two reports can't have the same name.
- The Bin icon helps delete a Saved Report. Note once a report it deleted, you cannot undo this action.
Multi-filtering your data in the Statistics tab

Note: Clicking on This Month will allow you to choose a date/date range to view statistics for. You can select a date up to two years prior to today.
You can filter the statistics showing in the currently selected tab using the multi-filtering options at the top of the screen. You can add multiple filters together to gain insights into your data. For example, if you are viewing costs for days in the Dates tab, you could choose to break that down by country and then further break it down by browser.
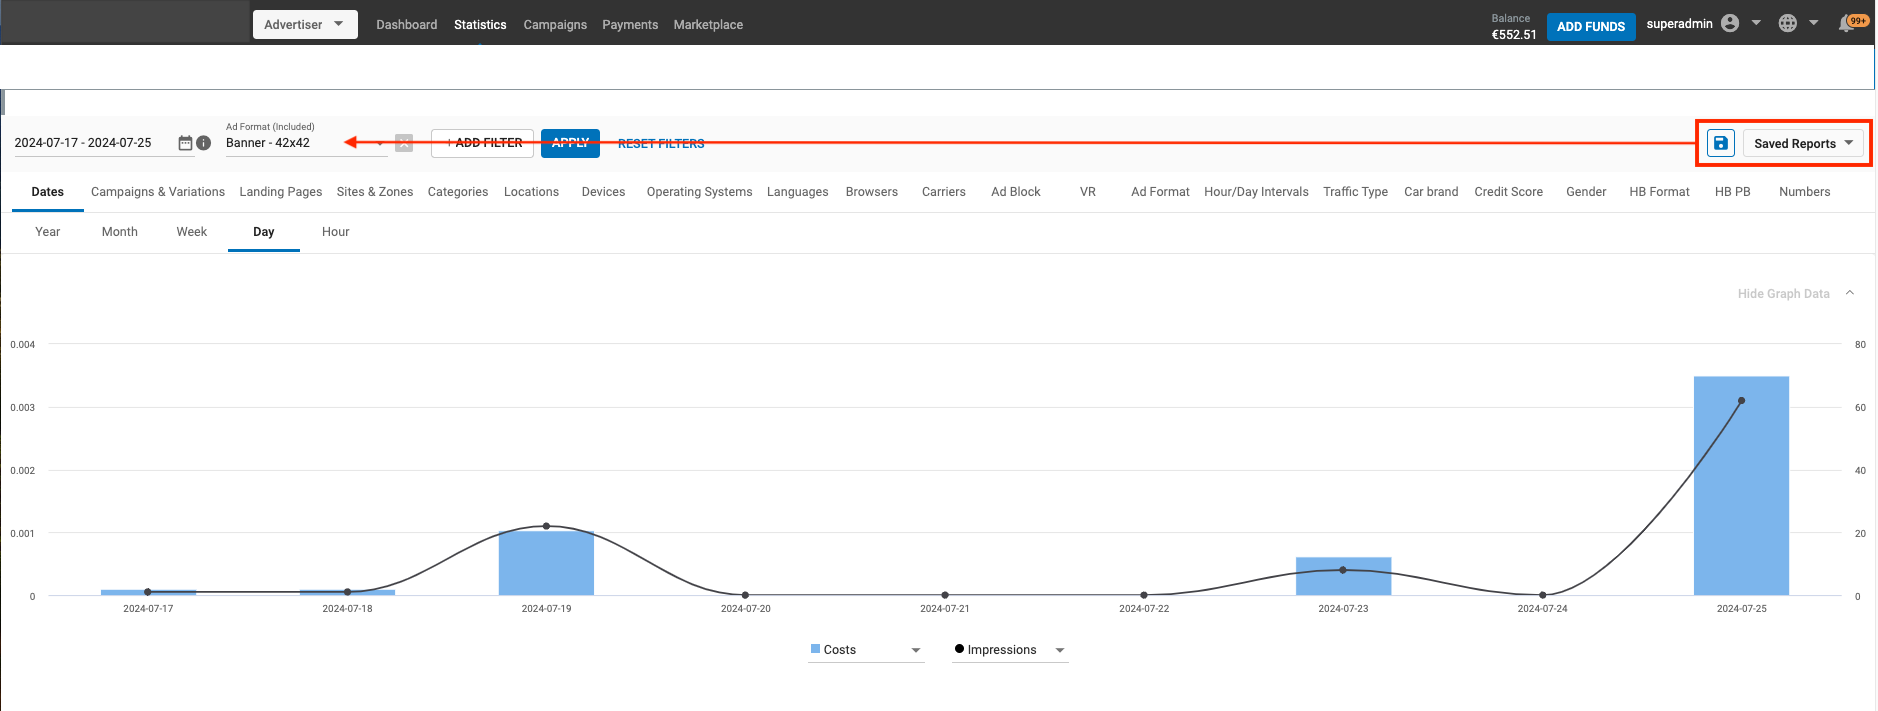
Using the filtering feature
To filter the currently selected tab by Country, Campaigns, Categories etc. click on the +ADD FILTER button and select the item you wish to filter by.
Tick the boxes beside the items you wish to view, and click APPLY. The results that you see will be filtered by the items that you have selected.
You can add more filters after the first one. For example, you might want to filter by Country and then by Device.
You can also filter the data by date, by clicking on the calendar icon to the left of the +ADD FILTER button.
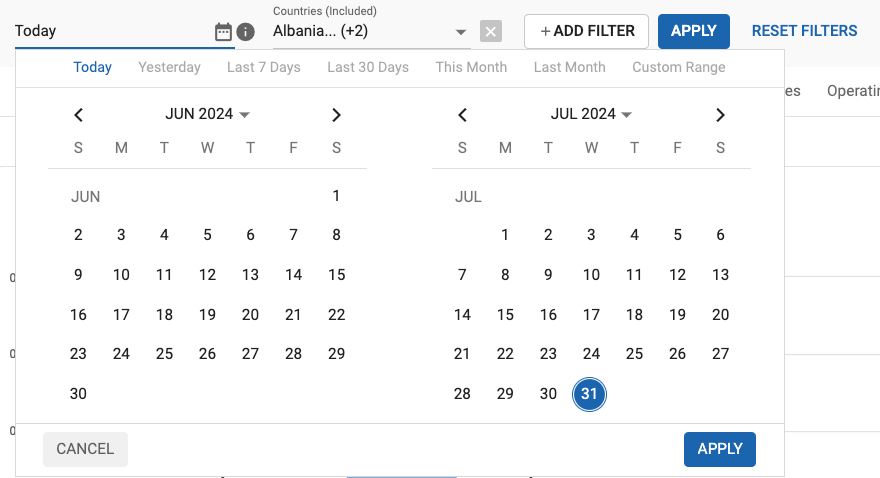
In the calendar box, you can select the time period you wish to view data for, either by dragging the mouse over the days you wish to select, or selecting from the predefined values:
- Today
- Yesterday
- Last 7 days
- Last 30 days
- This Month
- Last Month
- Custom Range
Note: Choosing This Month in the Calendar will only show data for this month up to the current date.
You can also drill down into your data in the Table Data panel. Doing this will automatically add a filter to the multifilter bar at the top of the Statistics tab.
The Graph Data Panel
Choosing what to display in the graphs

For any of the tabs in the Statistics tab, you can choose what information you would like to see in the graphs in the top half of the screen:
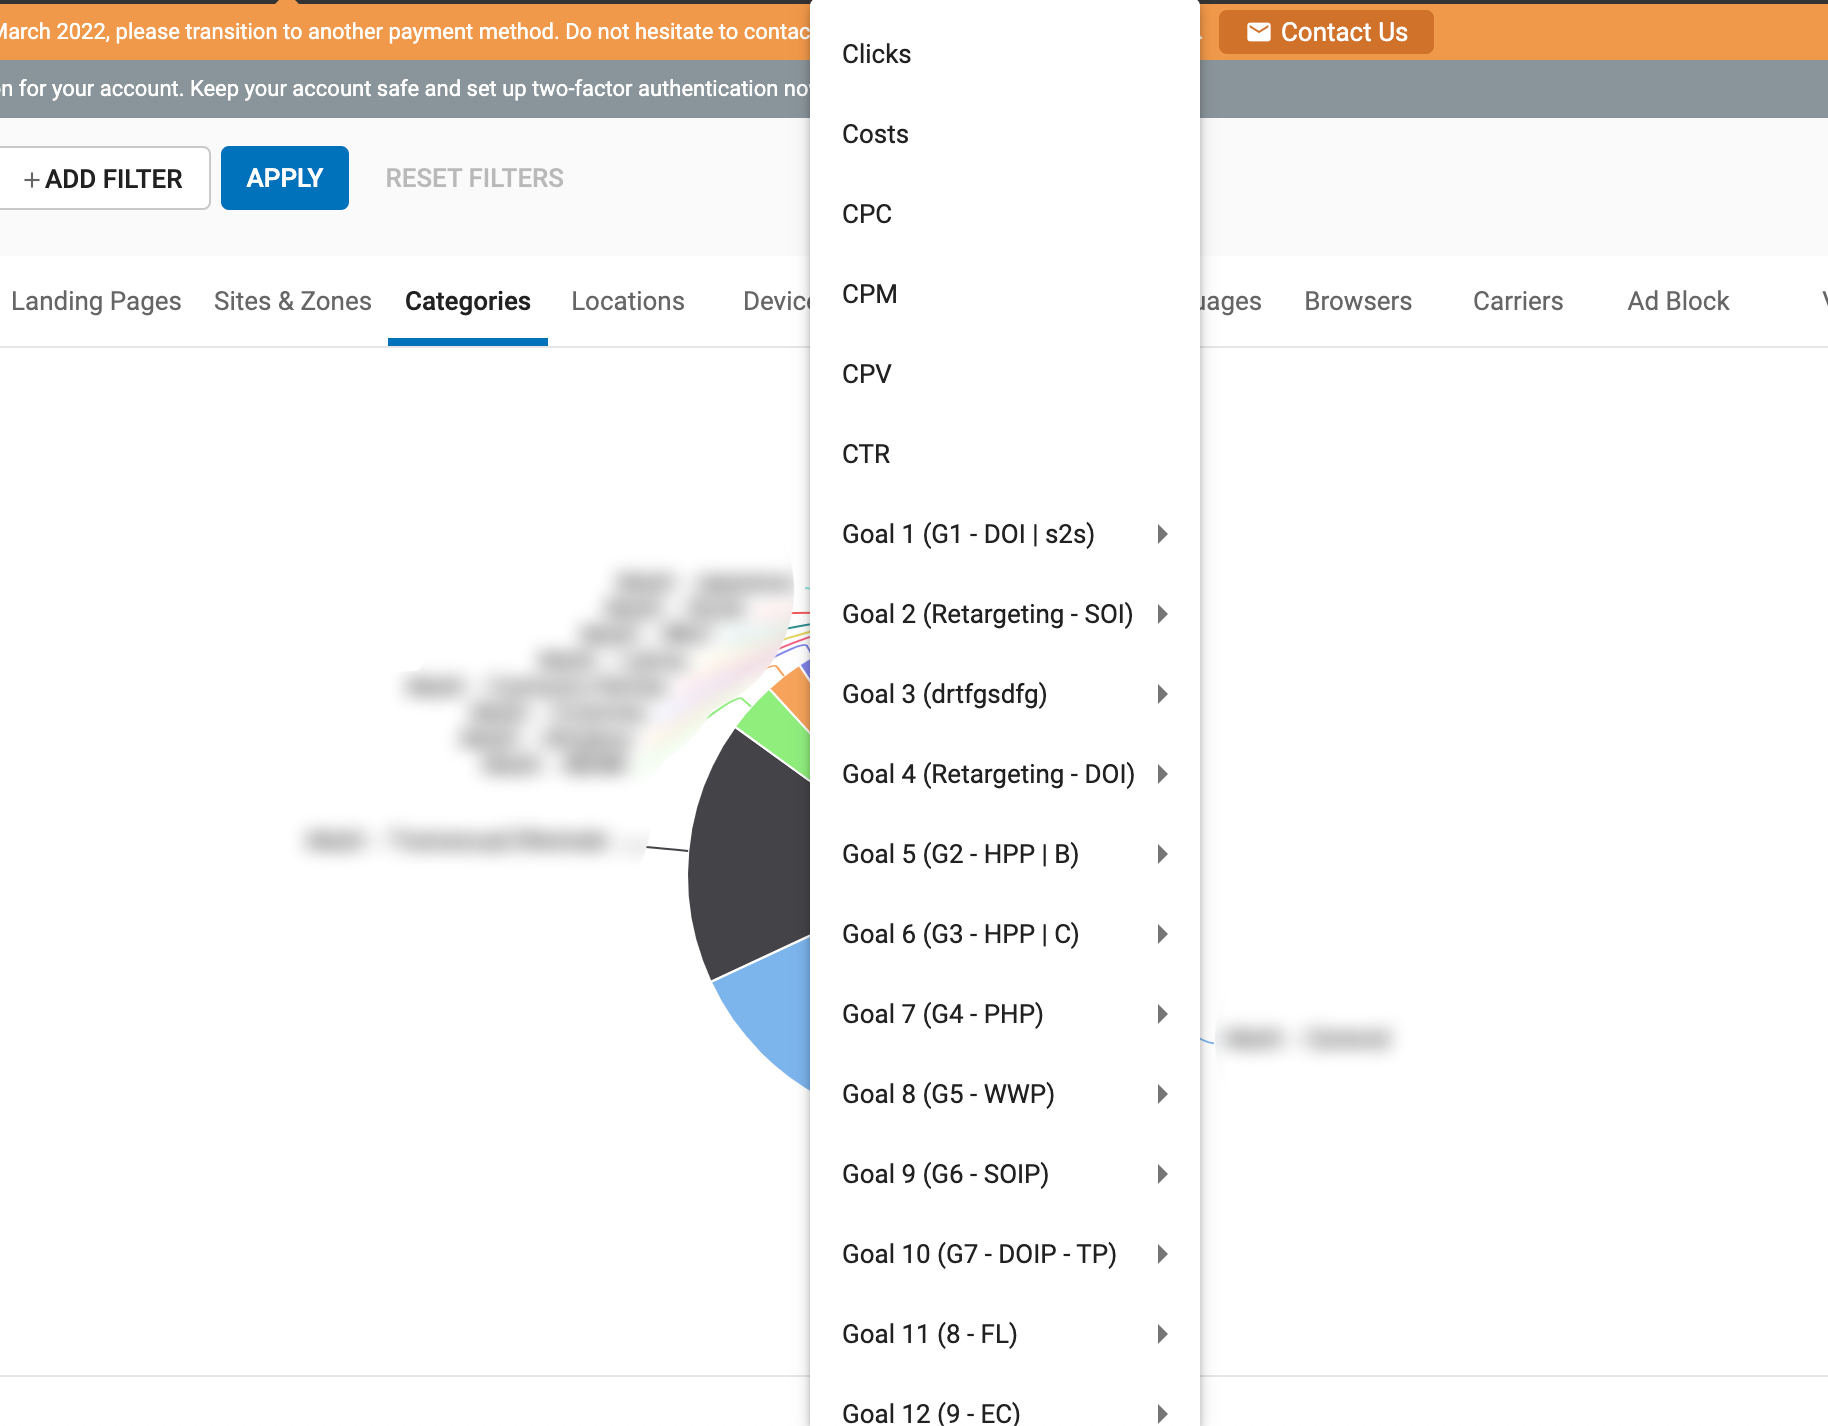
All the tabs in the Statistics tab allow you to view charts for Costs, CPC, Clicks, Impressions, Video Impressions, Views, Views Ratio, CPV, CPM, CTR and various Goals.
The following tabs all show a single pie chart with drop-down with the above options: Campaigns and Variations, Landing Pages, Sites & Zones, Categories, Devices, OS, Languages, Browsers, Carriers, and VR.
However, in the Dates tab, you can view two of the above items presented in two concurrent line and bar graphs. You can break these down by Hour, Day, Week, Month or Year by clicking on the sub-tabs.
In the Locations tab, you can roll over the world map to see your data broken down by country. You can zoom in and out of the map using the + and - buttons on the left.
Metrics Available
| Group | Metric | Description |
|---|---|---|
General |
Impressions | Number of ad impressions. |
| Total Impressions | Total Impressions measure the number of times an ad is displayed to users, regardless of whether it is clicked or interacted with. | |
| Impression Distribution | The proportion of Total Impressions attributed to a specific dimension value (i.e.., a campaign, advertiser, publisher, browser, etc.). It helps in understanding share of voice or traffic distribution. | |
| Clicks | Number of ad clicks. | |
| CPM | Cost per Mille. | |
| CPC | Cost per Click. | |
| CTR | Click through rate. | |
| Costs | Total cost of showing your ads. | |
| Video | Video Impressions | Number of times that the video ad thumbnail was shown. |
| Views | Number of times the video ad was viewed. | |
| CPV | Cost per View. | |
| Views Ratio | Number of video views to the number of impressions. | |
| RTB | Queries | Number of bid requests sent to the advertiser. |
| Success | The number of valid bid requests that were received. | |
| Avg. Bid | Average bid price for selected auctions. | |
| No Bid | Number of bid requests that did not return a bid as there were no campaigns available. | |
| No Bid Ratio | Percentage of requests that did not make it to the bid, against the total number of queries. | |
| Wins | Number of bid requests that won the auction. | |
| Win Ratio | Percentage of wins against the total number of queries. | |
| Errors | Number of bid requests that did not go through the bidding process due to errors. | |
| Errors Ratio | Percentage of Bid requests with errors against the total number of queries. | |
| Avg. Time | Average time taken between a request and response. | |
| Timeouts | Number of bid requests that were timed out with no response. | |
| Timeouts Ratio | Percentage of requests that have timed out against the total number of queries. | |
| Resp. Ratio | Percentage of bid responses out of the total number of bid requests. | |
| Conversion Tracking | Cnvs (Conversions) | Number of conversions that take place. |
| CR (Conversion Rate) | Records the percentage of users who have completed a desired action. This is calculated as Conversions / Clicks and then expressed as a %. | |
| CV (Conversion Value) | A monetary value of the conversion, and it is used to determine the Revenue, Profit and ROI (Return on Investment) of the campaign. Conversions values are based on the following options as set by the Advertiser on Conversion Goal setup. No Value: The goal was setup with no conversion value. Fixed - The goal will have a fixed value each time it's fired. Dynamic - A dynamic amount that was associated with the goal. This value is an average of all the conversions that have happened (Revenue/Conversions). |
|
| eCPA | effective Cost Per Acquisition. | |
| Profit | Determines the amount by which the Advertiser is profitable based on the revenue and cost metrics. | |
| Revenue | A monetary income that the Advertiser earns from the number of conversions that take place. | |
| ROAS | Return on Ad Spend measures the revenue generated for every unit of ad spend. | |
| ROI | This is calculated as Profit / Cost and expressed as a %. | |
| RPM | Revenue per Mille measures the revenue earned per 1,000 Impressions. | |
| RPC | Revenue per Click measures how much revenue is earned per individual Click. |
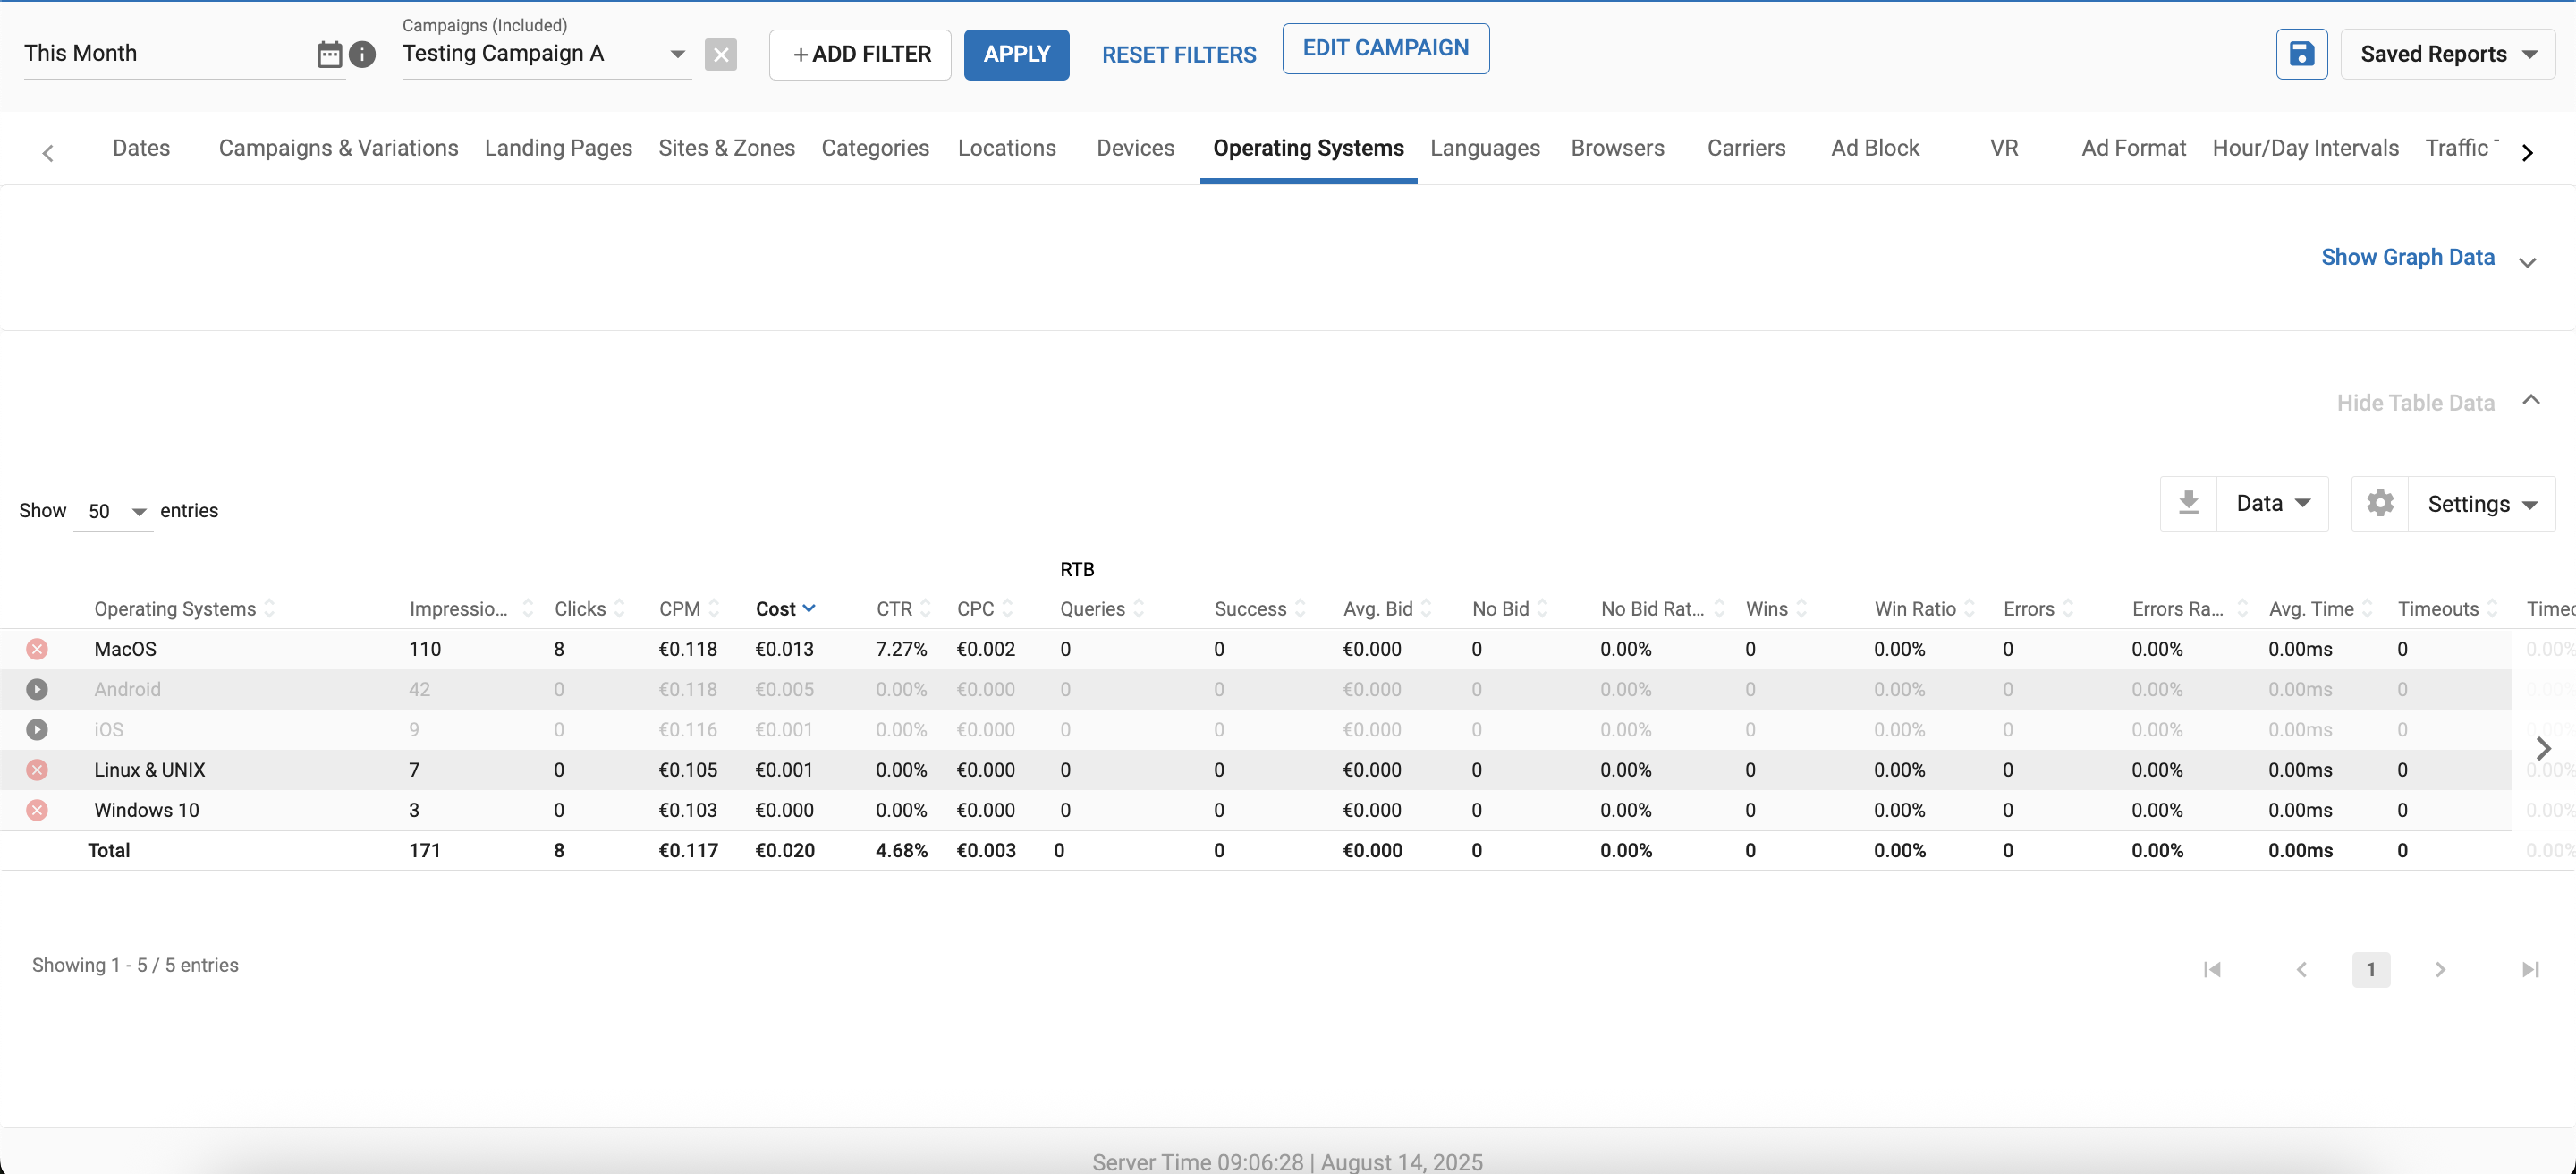
The Table Data Panel
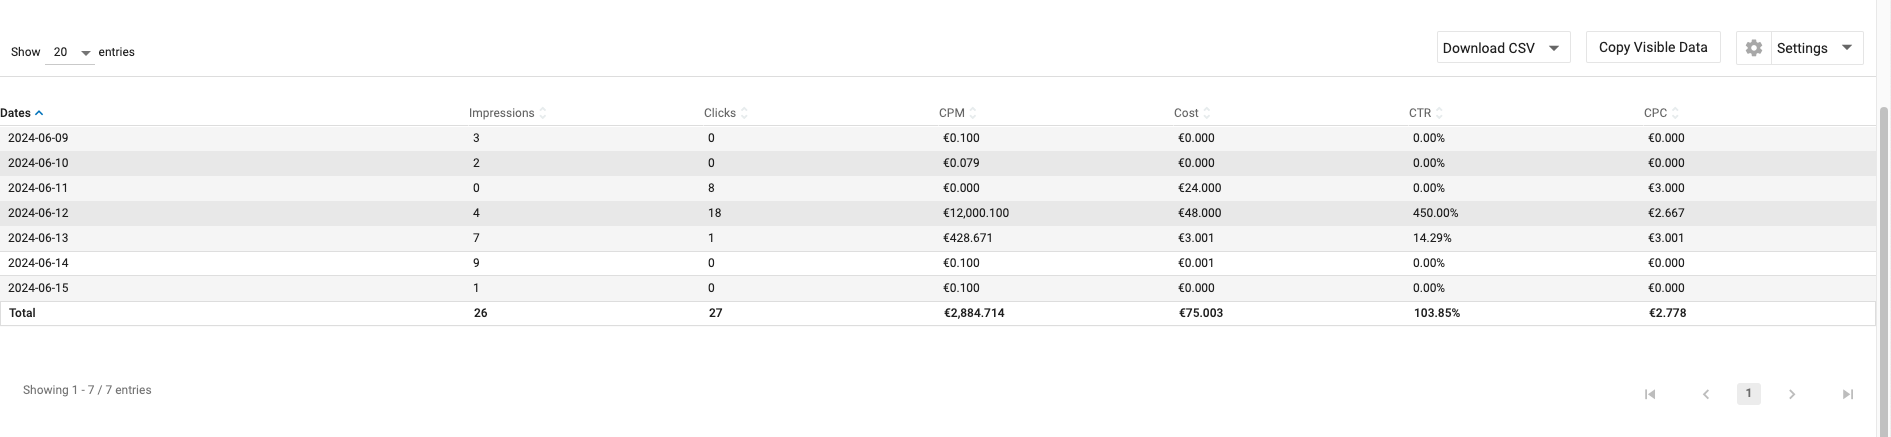
The Table Data panel shows the data in the Graph Data Panel in tabular format. In the Show X entries drop-down in the top right of the Table Data panel, you can choose how many lines of data you wish to see in the table. You can also click the arrows beside any of the column headers and sort the data from lowest to highest value.
The Settings Panel
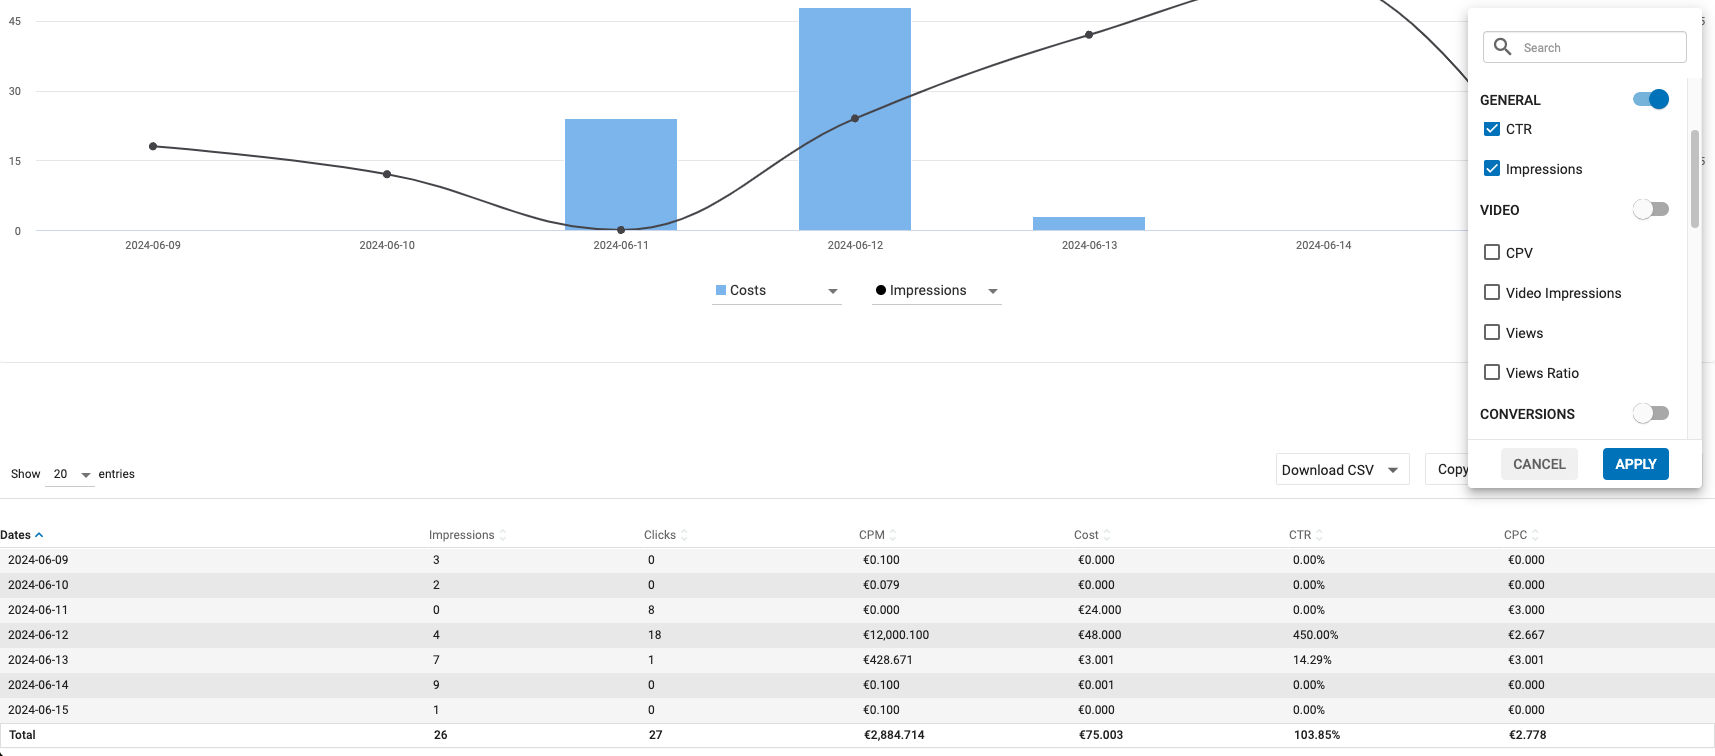
In the Settings Panel, you can choose which columns you want to show/hide in the table. The data is categorized into General, Video, Conversions, and RTB (if enabled). Within each category, you can select specific statistics.
- General, you can choose to display Impressions, Clicks, CPM, Costs, CTR, and CPC.
- Video, you can switch on and off the video stats Video Impressions, Views, Views Ratio, CPV.
- Conversions, you can choose which goals to show or hide. When a goal is enabled, you can select from the following metrics to display: Conversions, eCPA, CR, CV, Revenue, Profit, and ROI.
- RTB, if in your account you select several stats about your programmatic operations, such as Average Bid, Average Time, Queries, etc.
The Goals Panel
The Goals panel shows a detailed report on conversion tracking metrics. Is has two sections:
- Conversion Tracking: Displays overall metrics for all goals within the Advertiser account.
![]()
- Conversions: Provides metrics specific to each individual goal in the Advertiser account.
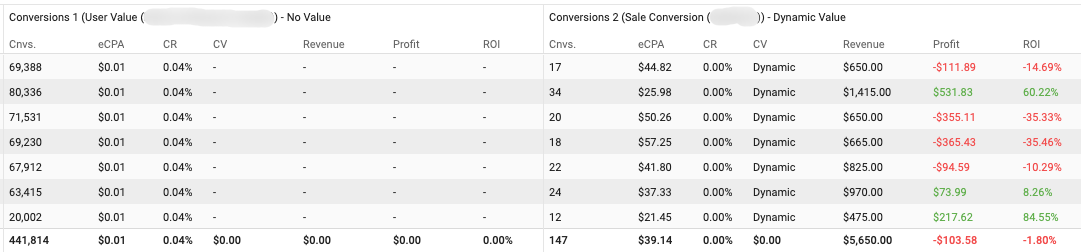
The metrics are:
- Cnvs (Conversions): Number of conversions that take place.
- eCPA: effective Cost Per Acquisition.
- CR (Conversion Rate): Records the percentage of users who have completed a desired action. This is calculated as Conversions / Clicks and then expressed as a %.
- CV (Conversion Value): A monetary value of the conversion, and it is used to determine the Revenue, Profit and ROI (Return on Investment) of the campaign. Conversions values are based on the following options as set by the Advertiser on Conversion Goal setup.
- No Value - The goal was setup with no conversion value.
- Fixed - The goal will have a fixed value each time it's fired.
- Dynamic - A dynamic amount that was associated with the goal. This value is an average of all the conversions that have happened (Revenue/Conversions).
- Profit: Determines the amount by which the Advertiser is profitable based on the revenue and cost metrics.
- Revenue: A monetary income that the Advertiser earns from the number of conversions that take place.
- ROI (Return on Investment): This is calculated as Profit / Cost and expressed as a %.
Note: In the Conversion Tracking section, the Conversion Value represents the average value of all conversions with a value. Conversions marked "No Value" are not included in this average.
Each column in the Goals data can be sorted from highest to lowest using the arrows at the top of each column.
You can learn more about setting up a goal here.
The Real Time Bidding Panel
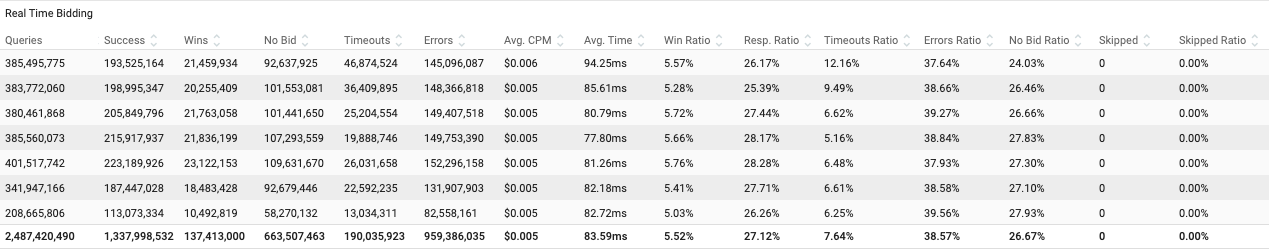
The Real Time Bidding panel shows the statistics of various related metrics achieved through real-time auctions that occur when an ad is requested by a page.
- Queries shows the number of bid requests sent to the advertiser.
- Success shows the number of bid requests that were successful and received a response with no errors.
- Wins shows the number of bid requests that won the auction.
- No Bid shows the number of bid requests that did not return a bid.
- Errors shows the number of bid requests that did not go through the bidding process due to some errors.
- Average CPM is a metric calculated as rtb_value / ( rtb_success - rtb_no_bid - rtb_skipped ) * 1000 / 100
- Average Time shows the Average time taken between a request and response.
- Timeouts shows the number of bid requests that were timed out with no response.
- Skipped shows the number of bid requests that where automatically throttled by the system.
- Win Ratio shows the percentage of wins against the total number of queries.
- Resp. Ratio shows the percentage of bid response against the total number of queries.
- Timeout Ratio shows the percentage of requests that have timed out against the total number of queries.
- No Bid Ratio shows the percentage of requests that did not make it to the bid against the total number of queries.
- Errors Ratio shows the percentage of Bid requests with errors against the total number of queries.
- Skipped Ratio shows the percentage of Skipped requests against the total number of queries.
Each column in the Real Time Bidding data can be sorted from highest to lowest using the arrows at the top of each column.
Downloading a CSV file of your statistics
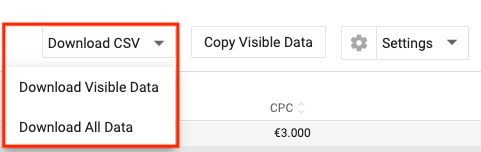
You can download your table in CSV format. On the Download CSV dropdown menu you can select from:
- Download Visible Data, this will download only the data that you have chosen to see using the checkboxes (General, Video, etc.).
- Download all Data, this will download everything stats regardless of what you have chosen to see in the table.
Copy Visible Data
You can also copy the data in the Table Data so that you can paste it elsewhere, such as into an Excel sheet. Choose Copy Visible Data to copy just the data that is visible in the table. This will copy only the data that you have chosen to see using the checkboxes above it (General, Video, Conversions, etc.).
Blocking Campaign Targeting Dimensions from Statistics
You can block or unblock targeting dimensions for the campaign you are currently viewing directly from the Statistics tab. This allows you to manage your campaign targeting without leaving the statistics view.
The block/unblock option on Statistics reports will only appear when:
- You have filtered your statistics report for a single campaign
- You are viewing one of the following dimensions:
- Browsers
- Devices
- Domains
- ISP
- Languages
- Locations
- Mobile Carriers
- Operating Systems